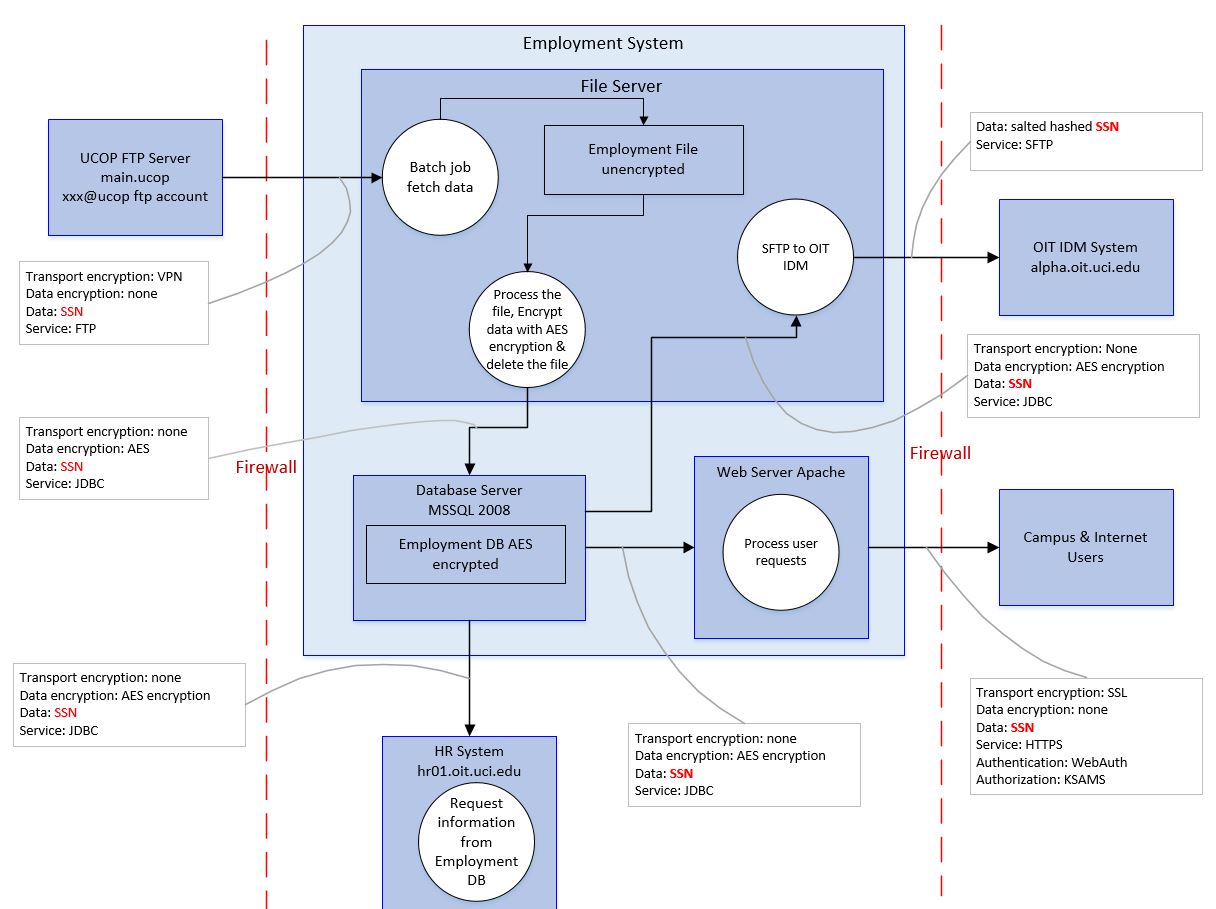
What is a Data Flow Diagram?
- A data flow diagram illustrates how data flows throughout the system. It answers the questions:
- How does data enter the system?
- How and where does data travel within the system?
- How does data exit the system?
- How is data changed or transformed throughout the system?
- Where is data stored?
- Key pieces: The hosts in your system that store or allow P3/P4 data to be transmitted through them, as well as all entry points of that data into the system, and all exit points of that data out of the system, and any flow of data within subsystems. Arrows should denote the direction of data flow. The type of data should be noted. The type of transport protocol, encryption, and any relevant access controls of data in transit should be noted. The type of data storage, encryption, and any relevant access controls of data at rest should be noted. Lines denoting boundaries of firewalled segments should be noted.
Process
Step 1: Start off by drawing a context diagram
- A context diagram is a diagram that illustrates how the system works from start to finish. Anyone who views the context diagram should be able to understand at a high-level how data is flowing throughout the system.

- Data Flow Diagram Notations:
Title Notation Description Entity 
Entities create or use data. Process 
Process – an activity that transforms or changes data. Data Store 
Data Store – a place where data is stored. Data Flow 
Data Flow – the movement of data. Arrows should denote the direction of data flow.
Step 2: Add a red dashed line for any firewalls being used.
Step 3: Add any technical processes that occurs within entities
Step 4: Add information tags to all data flow arrows. Information tag includes:
-
- Transport encryption
- Data encryption
- Data (highlight in red any P3/P4 data)
- Service
- Authentication
- Authorization